The links below are to PDF files containing all of the data received from the Stonesfield Neighbourhood Plan Survey – both the Household and the Individual surveys. There is also a PDF file with all the free text comments which appeared at the end of the survey.
For each question the results are presented in the form of a bar chart followed by the data in a table. Here is an example from the Individual Survey:
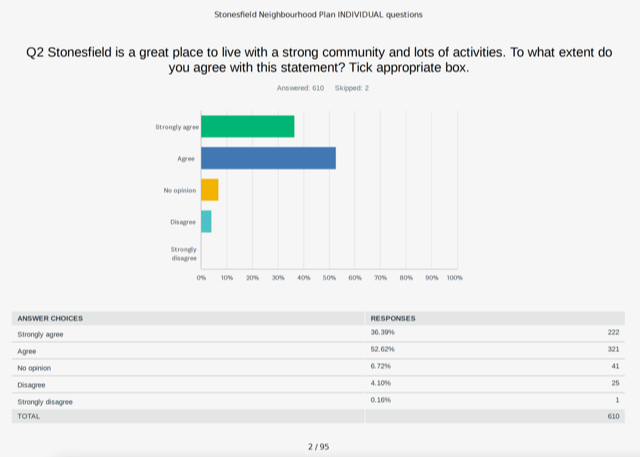
For each question we list the ANSWER CHOICES as they appeared in the survey.
The RESPONSES column shows the percentage of people ticking each ANSWER as a percentage of the total number of people who answered the question.
The final column shows the actual number of people who chose each answer.
Some questions didn’t supply answer choices, but gave the respondents the opportunity to write an answer. This resulted in a wide range of answers that we cannot print here. That data is stored separately.
At the end of the survey we invited people to ‘share other comments and/or feedback’. We are also supplying a link to a PDF document presenting all of the comments that respondents wrote. These are anonymous.